
How Does the MACD Indicator Work?
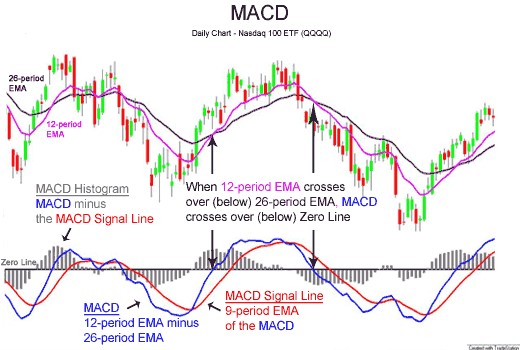
Image source: Wikipedia
The MACD indicator is available as an option on most advanced stock trading platforms. It is typically shown at the bottom of a stock’s price chart and comprises the following elements.
MACD Line
The MACD line is the forward oscillating trace and represents the 12-day Exponential Moving Average (EMA) minus the 26-day EMA. These moving averages are calculated using the closing price of the stock.
MACD line = 12-day EMA – 26-day EMA
Note that the EMA is a weighted moving average and reacts more significantly to recent price changes. This is in contrast to a simple moving average which would give equal weight to all data points.
Signal Line
The signal line is the latter oscillating trace and represents the 9-day EMA of the MACD line.
Signal line = 9-day EMA of MACD line
Zero Line
The zero line (or centerline) is the horizontal axis that the MACD line and signal line oscillate about.
Histogram
The histogram (or bar graph) is the graphical representation of the divergence and convergence of the MACD line and the signal line.
MACD histogram = MACD line – signal line
The greater the difference between the two lines, the greater the magnitude of the histogram bars. This indicates that the momentum of the price change is also increasing.
The direction of the bars is as follows:
- Positive - MACD is above the signal line
- Negative - MACD is below the signal line
How to Read the MACD
As the name implies, the MACD is meant to quantify the convergence and divergence of the MACD line and the signal line. This can be defined as follows:
- Convergence is when the two lines move toward each other
- Divergence is when the two lines move away from each other
Positive MACD values indicate that the 12-day EMA is greater than the 26-day EMA. This means the upside momentum is gaining.
Negative MACD values indicate that the 12-day EMA is below the 26-day EMA. This means the downside momentum is gaining.
Trading Interpretation
The MACD indicator can reveal some interesting trends in the movement of a security’s price. The following are a few of the most commonly used ways to interpret its performance.
Signal-Line Crossover
Signal line crossover is when the MACD and signal line cross. When this happens, the histogram bars change direction indicating that divergence has occurred.
When it's the MACD line that crosses to become the forward trace, this event is generally considered by investors to be “bullish” or a time to buy. Alternatively, if the signal line crosses to become the forward trace, it's considered to be “bearish” and a time to sell.
Divergences
Again, divergence is when the MACD moves away or diverges from the signal line. A divergence can be considered bullish if the equity reaches a new lower low while the MACD forms a new higher low. This is because the lower share price demonstrates the downtrend while the higher low of the MACD confirms there is less downside momentum.
Rapid Rises or Falls
If the MACD rises quickly or falls sharply, then this can be an indication that the security is overbought or oversold. The belief is that it will then return to normal levels.
MACD False Signals
As with all stock market analysis tools, the MACD can be misinterpreted. If used in isolation, it could lead to false positives or false negatives that could have adverse effects on the investor’s portfolio.
One example is a bullish signal-line crossover that’s followed by a sudden decline in the share price of the security. The inverse is also true. A bearish crossover could occur while the security’s share price suddenly climbs upward.
While the MACD is often used by investors to predict market entrance and exit opportunities, it's important to remember that all of the data it uses is based on past performance (i.e., a lagging indicator). Therefore, it should only be used in the context of other market performance indicators.
Who Created MACD?
Investor Gerald Appel created MACD in the late 1970s. He was a pioneer of many techniques in market timing and trading analysis. Mr. Appel also served as a financial manager for many clients for over 35 years before deciding to retire in 2012.
The Bottom Line
The Moving Average Convergence/Divergence indicator is a helpful tool for analyzing the movement of a stock price. It compares variations of the stocks moving average to reveal potential opportunities to enter or exit the market. However, it should be used in conjunction with other market indicators to avoid false signals.