
Technical Analysis Assumptions
The discipline of technical analysis has its foundation in the following assumptions:
● Trends exist in the market. When looking at a graph, we can use the relative movement of price and volume to make educated predictions about where the security might go next.
● Pricing is already worked into the market. To an extent, technical analysis is congruent with efficient market hypothesis. It assumes that all relevant news, fundamental analysis, and market psychology has been priced into the security. However, there are still movements that can be exploited for profit before the market reverts back to its overall trend.
● History repeats itself. Often the way price movement occurs is similar to patterns that can be observed in the past. Using these trends gives the trader some indication about how the market may react next.
How is Technical Analysis Performed?
At its core, technical analysis relies on two main variables:
● The time frame of the security’s price movement
● The technical indicators that the trader prefers to use
These two variables work in tandem with one another. For example, it wouldn’t make sense for a day trader to look at the hourly opening and closing prices of stock because we know that stock prices change by the second and can fluctuate throughout the day. Additionally, there most likely wouldn’t be enough data for the technical indicators to yield anything meaningful.
Someone, in this case, may prefer instead to look at price data in 15-minute increments or perhaps even a smaller time period. This in turn may provide better inputs for the technical indicators to reveal trends and opportunities.
Candlestick Charts
One of the most widely recognizable visuals associated with modern technical analysis is candlestick charts. Candlestick charts are a helpful way to graph the price movement of security for a given frame. Again, the time frame could be daily, hourly, by the minute, or whatever the trader prefers.
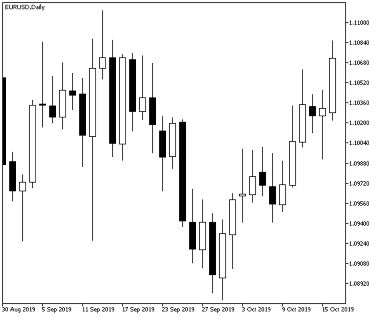
A candlestick chart reduces millions of price change measurements into a graph made up of thin bars. As the name implies, each bar has one line on the top and another at the bottom - making them look similar to candles.
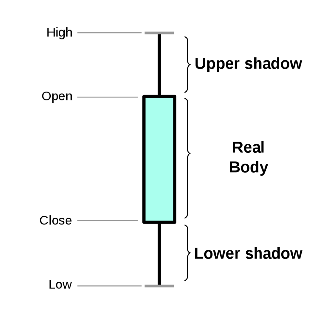
Each candlestick diagram represents the following information:
● The bar or thick part (i.e., the body of the candlestick) is the opening and closing price of the security for the given time period.
● The lines at the top and bottom of the bar (i.e., the wicks of the candle) are the highest and lowest prices that the security traded at for the given time period.
It’s helpful to also add color to candlestick charts so that you can quickly tell when the security closed at a higher or lower price than it opened with. This is typically done where:
● Green indicates the security is gaining value
● Red indicates the security is losing value
Note that most trading software allows the user to change the colors to any combination the user prefers.
Example
Let’s assume you’ve set up your trading software to report price movement by the hour. Within this time frame, the information is as follows:
● Opening price $100
● Closing price $105
● The highest price during this hour is $107
● The lowest price during this hour is $99
For this candlestick, the body would be formed by the $100 and $105 opening and closing prices. The wicks at the top and bottom would extend to $107 and $99 respectively. This candle would also be colored green to show that the price increased within the hour.
Technical Indicators
Once price data is arranged according to the desired time frame, the next step is to use technical indicators to identify potential entrance and exit opportunities to make a trade. There are many of these tools and, again, this will be at the trader’s discretion.
Below are some of the most commonly used technical indicators.
Moving Averages
With all data sets, the more measurement points it contains, the noisier it is. For this reason, it's often better practice to smooth out the data so that trends will be more easily identifiable.
A moving average is one way to do this for security. This can be expressed as either a:
● Simple moving averages (SMAs) - Uses a simple arithmetic average of prices over some time period.
● Exponential moving averages (EMAs) - Uses a greater weighting to recent prices over older price points within the time period.
Moving averages can be used in conjunction with one another to reveal specific information about security. A good example is the MACD or “moving average convergence/divergence”. This is an indicator that subtracts the 26-period EMA from the 12-period EMA to reveal the momentum of the security’s share price.
Support and Resistance Levels
As supply and demand change for a security, traders may begin to see activity that looks like an artificial floor or ceiling. In technical analysis, these so-called barriers are referred to as support and resistance levels.
Identification of these barriers can signal important trends. For instance, if the price is falling, then there's a good chance it may not fall below a prior level of support. If the price breaks through a resistance level, then it may continue to rise to new heights.
Fibonacci Retracements
When graphing candlesticks and other indicators, there need to be some generally accepted boundaries where the trader can expect that a price may reverse or stall. Many traders use Fibonacci retracement levels named after the Italian mathematician Leonardo Pisano (nicknamed Fibonacci). In technical analysis, the key Fibonacci ratios of 23.6%, 38.2%, and 61.8% are marked by fixed horizontal bounds on the graph and provide signals to the analyst when the plot crosses these values.
Bollinger Bands
Another way analysts can determine if the price of a security is moving in a peculiar manner is to calculate dynamic boundaries called Bollinger Bands. Bolinger Bands are comprised of three lines – the upper, middle, and lower bands. The middle line follows the trend of security while the upper and lower bands can be set to a specific number of standard deviations. Traders can monitor the security’s behavior by looking for signs of strength when it's in an uptrend or weakness when it's trending downward.
Fundamental Analysis vs Technical Analysis
While many people may be familiar with the concept of technical analysis from the popularization of day traders, there is another commonly used methodology known as fundamental analysis.
In fundamental analysis, the investor looks for clues about the security by examining traits that are intrinsic to it. These might be qualities such as the company’s financial statements or earnings projections. External influences may also be considered such as the current market and economic conditions.
This is in contrast to technical analysis where only the price movement of the security is what’s being reviewed. While the health of the company may be important, a day trader using technical analysis will prioritize exploiting short-term financial gain from exploiting price movements over holding the security for the long term based on its merits.
Limitations of Technical Analysis
While technical analysis is highly quantitative and based on historic price data, it’s not a perfect science and should be used with caution for the following reasons:
● Ignoring the security’s fundamentals. Because analysis is only performed using price information, important factors that can (or should) be considered are excluded. For example, the company may be heading towards bankruptcy; however, it would be impossible to know this simply by looking at only the company’s historical share prices.
● Indicators are not 100 percent accurate. Many indicators may flag buying or selling opportunities. However, these can sometimes be false signals that must be scrutinized and rationalized by the trader before they take action.
● Conclusions can be subjective. Every trader is free to interpret the data as they see fit based on their experience and knowledge of how to apply them.
The Bottom Line
Technical analysis is the use of a security's price chart to find trends and clues about which direction it may go next. This is typically done using specialized trading software that can display price movements as a candlestick chart and provide key performance indicators.
Technical analysis assumes that fluctuations in the market are predictable and can be exploited for gain; especially in the short term. However, the output is not always accurate and ignores the underlying fundamentals that could make the security and more attractive investment. Therefore, traders have to be mindful to use technical analysis in conjunction with other tools rather than just relying on a subjective evaluation.