
How Does the ADX Indicator Work?
The ADX can be thought of as a quantification of trend strength. Rather than signaling trend direction or momentum (like other indicators), it tells the analyst how much force there is behind a measurable trend.
The ADX is often used to help investors realize when the market might be in strong bull or bear territory. Though it was originally developed by Wilder for trading commodities and currency, the indicator can be applied to any financial market with daily changing prices such as stocks and ETFs (exchange-traded funds).
ADX Example
The ADX indicator is expressed as a graph that fluctuates between 0 and 100. In general, ADX readings:
● Below 20 indicate a trend weakness
● Above 40 indicates trend strength
● Above 50 indicate an extremely strong trend
To illustrate what this means, let’s create a hypothetical example.
Suppose that the price of a stock is moving up and down for several days between two prices, $40 and $50. In this case, an analyst would say that the direction of the stock is trending sideways because it's essentially stuck within a range. In this case, the ADX would most likely be below 20 because there’s no identifiable trend.
Consider what would happen if the price shoots up from $50 to $75 over the next two weeks. When this occurs, then the ADX would rise to 40 or higher because there is a clearly identifiable trend taking place.
Now suppose that instead of the stock price climbing, it went in the other direction trending downward from $50 to $25 over the next two weeks. For this situation, the investor’s natural instinct may be to assume that the ADX would also decrease. However, this is not correct since the ADX is not a directional indicator. What would actually happen is that the ADX would have again risen to 40 or higher. This is because, again, there is a clear trend taking place (regardless of the price’s actual direction).
In these examples, the strength of the trend was clearly identifiable. However, in real market activity, prices can sometimes fluctuate without any obvious observable pattern. For that reason, the ADX can be used as a confirmation tool to filter through noisy data and determine if the asset price is truly moving, whether it's one way or the other.
How is the ADX Indicator Calculated?
The ADX indicator is really the combination of two other indicators:
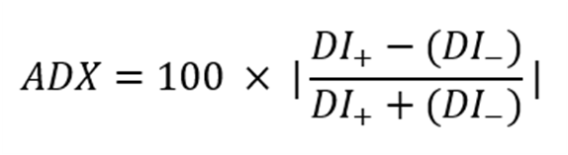
● DI+, positive directional indicator = The smoothed 14-day moving average of today's high price minus yesterday's high price
● DI-, negative directional indicator = The smoothed 14-day moving average of yesterday's low price minus today's low price
(Note: Modern software allows users to change the days used for calculating the directional indicators if another number besides 14 is preferred.)
The equation for ADX can be expressed as:
Interpreting the ADX Indicator
Because ADX only indicates the strength of a trend and not the direction, most technical analysis software packages will plot all three lines on the same graph: ADX, DI+, and DI-.
By putting them all together, the investor can initially spot:
● Positive or bull trends when the DI+ line is higher than the DI- line
● Negative or bear trends when the DI- line is higher than the DI+ line
The intensity of this trend can then be confirmed by looking at the value of the ADX indicator. As the positive or negative trend persists, the ADX will begin to rise. However, if the market moves sideways, then the ADX will decrease.
Crossovers
Many investors will use all three lines as part of their analysis to look for potential buying and selling opportunities. One such occurrence is known as a “crossover.”
When the DI+ line crosses over the DI- line, then the rate of positive price changes is greater than those of negative price changes. If this happens when the ADX is above 20, then it may be a good time to enter the market.
Conversely, when the DI- line crosses over the DI+ line, then the rate of negative price changes is greater than those of positive price changes. If this happens when the ADX is above 20, then it may be a good time to exit the market.
Limitations of the ADX Indicator
As with many other tools in technical analysis, the ADX is a lagging indicator. Because it relies on past market performance, it can only signal the strength of an upward or downward trend after the occurrence has already taken place. Therefore, it's best to use the ADX as a confirmation tool in conjunction with other technical indicators.
The Bottom Line
The ADX indicator is a technical analysis tool that can be used to measure the strength of a relative upward or downward trend. While it does not tell which direction market prices are heading, it does demonstrate the intensity of the trend. Generally, ADX values below 20 will indicate weak strength while those above 40 can indicate greater trend strength.
Most market analysis software will plot the ADX with both positive and negative directional indicators. Investors will monitor the movements of these graphs to look for optimal times to buy and sell assets.