
How Does the Capital Asset Pricing Model Work?
For any investment, there is a risk-return trade-off. This process of weighing the risk and determining the appropriateness of the reward is also referred to as mean-variance analysis.
Investors always have the option to put their money into assets that produce a given rate of return and carry virtually no risk. Examples of this would be the interest earned from a high-yield savings account, a certificate of deposit (CD), or U.S. government treasury bills (T-bills).
However, many investors are willing to take on additional risk if it means the possibility of earning a greater rate of return. This is why investors will often put their money into stocks, mutual funds, exchange-traded funds (ETFs), and other securities.
In other words, investors expect to earn at least the risk-free rate plus some risk premium (reward) for the risk they’re agreeing to endure. Otherwise, if the security didn’t deliver higher returns, then there would be no incentive for the investor to take on the risk of potentially losing their principal.
CAPM Equation
The correlation between expected return and market risk can be summarized by the following equation:
Market Risk Premium = [E(Ri) - Rf ] / βi
Where:
● Market Risk Premium = The expected reward for taking extra risk
● E(Ri) = The expected return of an investment.
● Rf = The risk-free rate. Most analysts use the current U.S. T-bill rate as the value when performing their calculations.
● βi = Beta, the relationship between the investment and its market. When an investment has a beta of less than 1, the asset is less risky than the overall market. When an investment has a beta greater than 1, the asset is riskier than the overall market.
The market risk premium can also be written as:
Market Risk Premium = E(Rm) - Rf
Where:
● E(Rm) = The expected return of the market. With equities, the S&P 500 stock market index is often used as the benchmark.
Putting these concepts together, the equation for CAPM can be written as:
[E(Ri) - Rf ] / βi = E(Rm) - Rf
Or
E(Ri) = Rf + [ βi x [E(Rm) - Rf] ]
In this form of the equation, we can now quantify how the expected rate of an investment is the risk-free rate plus the market risk premium scaled against beta.
CAPM Example
To demonstrate the CAPM in action, let’s assume an investor is considering buying shares of a new tech company stock. Since the company is in a volatile industry and relatively new, we can assume it carries a higher-than-usual beta = 1.5.
During this same time, we also know that:
● The risk-free rate, Rf = 4.0 percent
● The expected return of the stock market, E(Rm) = 10.0 percent
Therefore, the expected return on this investment is:
E(R) = 4.0 + (1.5 (10.0 - 4.0)) = 13.0 percent
In other words, for an investor to take on this much risk, this stock must pay out at least 13.0 percent to make it worthwhile for the investor to proceed.
Graphing the CAPM
The CAPM seeks to provide a framework for an asset’s market risk premium. Simply put, the higher the risk, the greater the expected return.
We can create a visual representation of the CAPM by plotting what’s known as the security market line (SML). This can be done by graphing:
● x-axis = Market beta
● y-axis = Expected return of the securities for the given beta
The security market line is a linear plot of the beta of different securities. It begins at the y-intercept which corresponds to the Rf. The security market line then slopes upward to the right as beta increases.
Referring back to the earlier example,
● At x = 0, the Rf would equal 4.0 percent
● At beta = 1.0, the E(Rm) would equal 10.0 percent
This graphical representation can help financial analysts to compare various investments against one another and determine which ones are above or below the security market line. Generally:
● Assets above the security market line are undervalued
● Assets below the security market line are overvalued
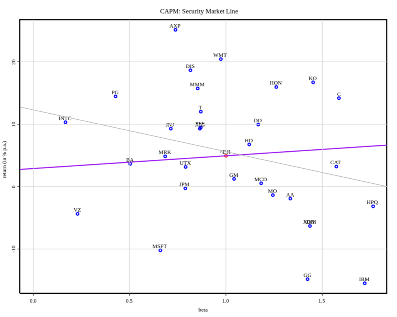
For example, consider this depiction of the CAPM and the security market line (purple line) for the Dow Jones Industrial Average over 3 years for monthly data. Notice how some stocks are above and below the SML.
Can CAPM Be Negative?
Yes. Since the CAPM begins with the risk-free rate of the market, one might think that all graphs will always be positive. However, this is not true if the beta is negative. In this scenario, the asset in question would have a negative correlation with the broader market.
A common example is gold. Gold tends to move in the opposite direction of the general stock market. Therefore, it would have a negative beta and decrease as securities climb upward.
Who Invented the CAPM?
The CAPM was developed in the early 1960s by Jack Treynor, William Sharpe, John Lintner, and Jan Mossin. They were building on the earlier work of diversification and modern portfolio theory proposed by Harry Markowitz.
Arbitrage Pricing Theory vs CAPM
After the initial development of the CAPM, economist Stephen Ross developed the arbitrage pricing theory (APT) in 1976 as an alternative to the CAPM. Unlike its predecessor, APT works on the basis that security prices are driven by multiple factors, including those from outside the company such as macroeconomic forces. Therefore, a separate beta is also needed in relation to each factor.
Returning to the previous example with the tech company, there may be other risks to consider. For instance:
● The overall market may be in bear territory
● Inflation may be high
● The company may have missed its earnings target last quarter
All of these factors will carry their own beta and therefore can influence the expected outcome of the investment.
The Bottom Line
The capital asset pricing model seeks to connect an investor's acceptable level of beta with how much return they should expect to receive. In return for putting their money into securities that may lose value, the investor wants to be rewarded with an appropriately sized market risk premium.
Visually, the CAPM can be represented by plotting the security market line and then determining the return of a given set of assets. This is intended to help investors diversify and find companies that may be over or undervalued.