
Understanding the Yield Curve
To better understand the inverted yield curve, you must first understand the yield curve itself and what it represents.
Treasury Bonds
The yield curve is a representation of the bond market - specifically, U.S. treasury bills. Bonds are often regarded as conservative investments because, unlike stocks, a bond is an instrument of debt. When a bond is purchased from the government or a company, they promise to return your principal alongside periodic payments of interest.
Yield Rates
Because bonds produce interest, they have what’s called a yield. Yield is simply the interest rate divided by the price. For example, if a $1,000 bond paid $50 in interest each year, then its yield would be $50 / $1,000 = 5.0%.
However, bond prices don’t stay the same forever. Just like any other investment, they are subject to the laws of supply and demand which can cause them to be sold in the market for more or less than they were originally purchased for.
Typically when the economy is good and investors seek higher returns, they will sell their long-term bonds. This causes the price to drop and makes their yield higher. For example, suppose that the same $1,000 bond can now only get $950 on the bond market. Since it pays the same $50 of interest, the new yield would be $50 / $950 = 5.3%. Hence, this is why there is an inverse relationship between bond prices and bond yields.
The opposite is also true. When the economy is heading for trouble, investors may flock to bonds for safety. When this happens, increased demand will drive up the price. This will result in the yield going down.
Short-Term Yield Rates
U.S. Treasury bonds can be sold in a variety of durations lasting from just a few months to several decades. Typically someone who buys a short-term bond wants liquidity - they wish to get their money back relatively soon and don’t want it to be tied up for a long time.
A major influence on the U.S. Treasury bond interest rates is the Federal Reserve. When the Fed declares its latest Federal Funds rate, short-term bonds will follow in the same direction. Because the duration of a short-term bond is so small, its yield is nearly the same as the interest rate from when it was first sold.
Long-Term Yield Rates
While the actions of the Federal Reserve will also have an impact on the price of new long-term Treasury bonds, it's important to remember that most of the market is made up of older bonds waiting to mature. Investors will trade these previously issued long-term bonds according to their current demand. Hence, it is the market that ultimately decides the price and resulting yield value of long-term bonds.
Putting It All Together - The Yield Curve
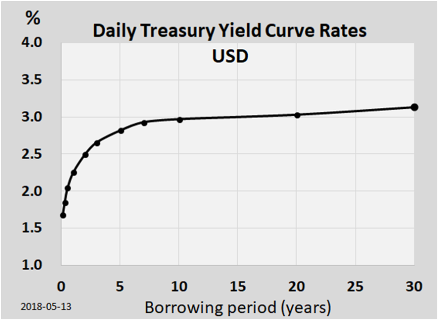
Given the discrepancy between short and long-term bond yields, economists will often graph them as a curve. The x-axis will represent the duration until bond maturity and the y-axis will represent the bond yield.
Interpreting the Yield Curve
The resulting plot of bond yields will generally follow one of three types of shapes:
● Normal - A normal yield curve will slope upward meaning that long-term yields are greater than those in the short-term. This can be interpreted as a sign that the economy is in good shape because investors can expect to receive a better yield the longer they hold onto the bond (as they should).
● Flat - A flat yield curve will have almost no slope at all - meaning short-term and long-term yields are somewhat equal. This often happens when the Federal Reserve begins raising interest rates. While it does not necessarily mean that the economy is in trouble, it does raise caution for some economists and investors.
● Inverted - An inverted yield curve is when the slope trends downward. In this case, short-term yields are higher than long-term ones indicating that investors have little faith in long-term returns. Therefore, this can be seen as a sign that the economy may be in trouble.
Rather than comment on the shape of the yield curve, many economists will often quantify this difference in bond yields by speaking about their spread. Specifically, they will compare the spread between the three-month and 10-year treasury yields.
The Inverted Yield Curve and Recessions
While the inverted yield curve is not a perfect tool for predicting economic recessions, it does have a very track record. Since 1970, all U.S. recessions have been preceded by an inverted yield curve (eight so far).
Many economists argue that this is true because of the yield curve’s natural relationship to the business cycle. Typically, when short-term interest rates go high, this is due to the actions of the Fed as they attempt to combat inflation. When this occurs, the cost of doing business and borrowing money becomes more expensive. For this reason, businesses will contract and a recession will generally follow.
Inversely, when the Fed lowers interest rates to stimulate the economy, borrowing money becomes cheap again. Businesses will begin to expand, increase production, and hire more employees. This leads to an increase in demand and causes the economy to eventually exit its recession. Often, by the time this happens, the yield curve is back to normal.
Until this happens, investors will look at the time following the inverted yield curve with caution. They’d be wise not to make any risky choices and instead may want to take advantage of the high yields available for cash and short-term bondholders.
The Bottom Line
An inverted yield curve is a graph that shows short-term U.S. Treasury bond yields having a greater yield than long-term bonds. This can be regarded as an indicator that the economy may be heading into a recession. Although no one knows how soon or how long there may be trouble with the economy, investors may wish to proceed with caution and monitor their portfolios closely.