
The Phillips Curve Explained
The Phillips Curve is typically depicted as a downward-sloping line or curve that is graphed along two axes:
● X-axis - Unemployment
● Y-axis - Inflation
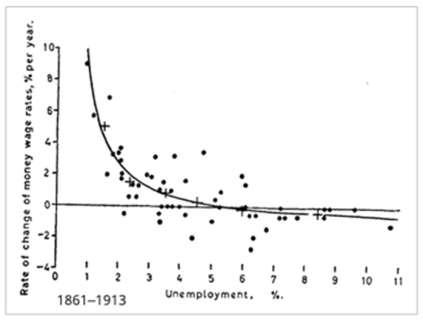
The inference from this plot is that as inflation increases, the cost of doing business becomes more expensive and layoffs become imminent. Likewise, as inflation goes down, businesses have more access to capital and can hire more workers.
Along this curve, there exists some point where unemployment and inflation are balanced. This occurs when the target inflation rate is achieved and results in what economists call "full employment" or the natural unemployment rate.
Short-Run vs Long-Run Philips Curve
In 1968, the Nobel Prize-winning economist Milton Freidman published findings that suggested that in the long run, monetary policy could not lower unemployment by raising inflation. Therefore, economists began to recognize that there's a difference between the Phillips curve in the short run versus the long run.
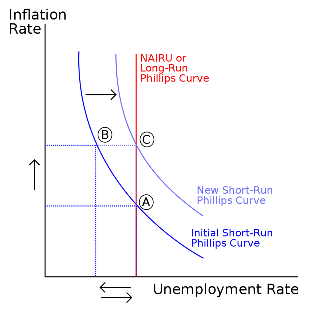
The Short-Run Philips Curve (SRPC) is the normal downward-sloping curve. Note that as aggregate demand and supply shift, so too can the SRPC.
The Long-Run Philips Curve (LRPC) is simply a vertical line that represents the natural rate of unemployment. The significance of the LRPC is that while the government can have short-term influences on inflation and employment, the natural tendency of the economy eventually reverts back due to some nominal rate of people who do not work for one reason or another.
In summary, while the short-run Phillips curve may shift the left and right as supply and demand change, over the long-run it will always climb up the LRPC curve. This is because the economy will always come back to a state of full employment while inflation continues the cause the price of everything to rise over time.
The Role of the Federal Reserve
In the U.S., the role of the Federal Reserve is to monitor and make adjustments as necessary to the economy. This is done through a dual mandate to maintain price stability as well as promote maximum sustainable employment. Effectively, they are tasked with balancing the short-run Phillips curve.
This is not an easy outcome to achieve. While the Fed has consistently stated that they have an inflation target of 2 percent, one has to remember that inflation is a lagging indicator. It's not fully known if prices have increased until 12 months after the fact when the latest CPI (Consumer Price Index) data is available from the U.S. Bureau of Labor and Statistics.
When it’s been determined that inflation has risen to an unacceptable level, the Fed will start by raising the Federal Funds rate. This causes banks to increase their lending rates resulting in the economy contracting and eventually conducting layoffs. The Fed must make these rate changes gradually or they can easily tip the scales and throw the economy into a recession.
Does the Phillips Curve Always Hold True?
During the 1960s, the Phillips curve had become very popular, and it was widely accepted that the government had to make a choice between low inflation or low unemployment. However, in the decades that followed, there have been many times when the economy deviated from the Phillips curve.
Stagflation in the 1970s
Throughout the 1970s, the U.S. entered into a period where demand had become stagnant, and inflation was on the rise (hence the term "stagflation"). This was largely due to the tripling of crude oil prices that resulted from the Arab oil embargo.
As a reaction, the Fed raised interest rates causing unemployment to also go up. However, this didn’t have the desired impact on inflation, and so the Fed took even more drastic measures raising interest rates as high as 21 percent. This created an uncomfortable decade of high inflation and high unemployment.
The Rise of Technology in the 1990s
In the 1990s, the opposite of what happened in the 70s began to occur. Thanks to the rise of the Internet and technology, firms needed labor, and this helped to decrease unemployment. However, the economy was also going through a period of growth, so inflation was low too.
The Expansion of the 2010s
Similar to the 1990s, the years following the Great Recession of 2008 were not characteristic of the Phillips curve. For more than ten years until the start of the COVID pandemic, the U.S. economy continued to expand while unemployment sank to some of its lowest levels on record. This has largely been attributed to a relatively new monetary policy by the Fed called Quantitative Easing (QE).
The Bottom Line
The Phillips Curve is the observation that inflation and unemployment have a negative correlation to one another. As one goes up, the other goes down, and vice versa.
While this is the usual tendency in the short-term, it’s important to recognize that in reality governments cannot control unemployment over the long run. As aggregate supply and demand shift, the economy will eventually revert back to its natural state even though market prices have risen.
Furthermore, there can be many exceptions to the Phillips Curve. In years where significant political or technological changes have occurred, the correlation between inflation and unemployment can be broken down. Therefore, it’s helpful to think of the Phillips Curve as more of a simplification and less of a rule.