
What is Price Elasticity?
In economics, both demand and supply for any product can be graphed according to its price and quantity - the expected number of units to be sold. When it comes to demand, the typical relationship is that as the price of something goes up, its corresponding demand decreases.
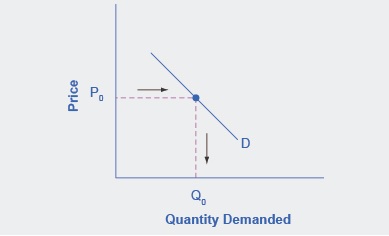
Image Source: Wikipedia Commons
The question that businesses want to know is: By how much? This incremental change is what’s known as the price elasticity of demand. PED can be defined as the ratio between the percentage change in the quantity demanded against the corresponding percent change in price.
Mathematically, this is also called the line’s coefficient. Note that the price elasticity of demand is almost always negative. This is because demand typically has an inverse relationship between units sold versus price. However, most companies will ignore the negative sign.
It's critical that a company collects this type of data because making predictions about consumer habits can be challenging. By testing price differences, they can study this behavior and learn more about how they'll react. This helps them to reduce uncertainty and set price points for better profit optimization.
Price Elasticity of Demand Equation
The price elasticity of demand can be defined by the following equation:
PED = ( Delta QD / Delta Price )
Where:
- Delta QD = Percentage change in quantity demanded.
- Delta Price = Percentage change in price.
Example
Suppose a manufacturer has a product that it sells for $100 per unit and they move 100,000 units per month. They do some market testing and determine that if the price was raised to $115 per unit, the demand would only shift to 90,000 units.
In this case:
- Delta QD = (90,000 units - 100,000 units) / 100,000 units = -10%
- Delta Price = ($115 - $100) / $100 = 15%
- PED = 15% / -10% = -1.5 or simply “1.5”
Categories of Price Elasticity of Demand
There are five main zones of price elasticity.
Unitary Elastic
PED = 1. Unitary elastic demand occurs when the change in demand is the same proportion as the change in price.
For example, most grocery items can be thought of as unitary. If the price goes up or down, demand will also likely go down or up at the same rate because there are so many other substitutes available.
Relatively Elastic
PED > 1. Demand is sensitive to price changes.
Luxury goods are an example of something with elastic demand. Some consumers may be willing to buy a high-end car or watch at one price. However, if that price goes up even a little bit, they might quickly reconsider their decision and save their money for something else.
Perfectly Elastic
PED = infinity. If the price changes at all, then there will be no demand.
Most commodities can be described as perfectly elastic. For example, a rice manufacturer can’t arbitrarily set a higher price for its product. Given that there are so many other rice suppliers in the world, no one would buy from them at this higher price. Therefore, they have to stick to the current market price if they expect to make any sales.
Relatively Inelastic
PED < 1. Demand is insensitive to price changes.
Gasoline is an example of inelastic demand. When the price goes up, consumers have little choice but to pay this new price if they want to continue driving their vehicles. However, they can react in small ways by driving less or possibly switching to vehicles that don’t require gasoline.
Perfectly Inelastic
PED = 0. There is no change in demand regardless of a change in price.
An example of this would be certain life-sustaining prescription drugs. Since people may depend on their medication to live and there are no available substitutes, they have no choice but to pay whatever price the drug manufacturer commands.
Total Revenue Test
As businesses graph the price elasticity of demand, they want to know just how much they should increase (or decrease) a good or service to optimize their earnings. They can approximate this by finding the volume of a "box" underneath this demand curve at various price points.
Hence,
- The greater the volume, the more revenue the business can expect to generate
- The lower the volume, the less revenue the business can expect to generate
The total revenue test will be greatly impacted by whether the demand curve is elastic or inelastic.
- Elastic curves will have greater revenue as the price goes down, and vice versa. For example, clothing retailers will often throw sales because they know it will attract more shoppers. Even though the price per unit decreases, their overall sales volume will improve.
- Ineslatic curves will have greater revenue as the price goes up, and vice versa. For example, a gas station never has a sale on gas because the demand is inelastic. Therefore, there would be no revenue incentive to do so.
The Bottom Line
The price elasticity of demand can be thought of as how much change there will be in the demand for a good or service if the price changes. By comparing the relative percentage changes of quantity versus price, we get a coefficient that helps us understand how elastic this demand curve may be.
Products can be described as being anywhere from perfectly inelastic to perfectly elastic. It's important for businesses to understand and test these models so that they can set an optimal price point for their products and maximize the potential total revenue.