
Types of Variance
In statistics, there are generally two types of variance:
● Population Variance - When the entire data set (i.e., the population) is available and the spread of all values can be found. For example, if 100 people were in the same room and everyone gave their height, then we could measure the variance for the full population of people contained in the room.
● Sample Variance - When the entire data set is not available and only a sample set of the population can be found. Oftentimes, data sets are too large and it's impractical to measure every point. An example would be the height of all people in a state or country. Yet, we still need to draw conclusions about the population of data. Therefore, we’ll calculate the variance of a sample set of this data and let it serve as the variance of the entire population.
How is Variance Calculated?
Variance is calculated by using the following formula:
σ^2 = [ Σ (xi - xmean)^2 ] / N
Where:
- xi = Each value in the data set
- xmean = Mean of all values in the data set
- N = Number of values or observations in the data set
Variance Example
To demonstrate how variance works, consider a simple data set of five numbers:
10, 14, 15, 17, and 20
Before calculating the variance, the first thing we need to do is find the average or mean of this data set.
xmean = Σ xi / N = (10 + 14 + 15 + 17 + 20) / 5 = 15.2
Next, we can now compare each value to the mean:
σ^2 = [(10 - 15.2)^2 + (14 - 15.2)^2 + (15 - 15.2)^2 + (17 - 15.2)^2 + (20 - 15.2)^2] / 5 = 10.96
In other words, the spread or “squared distance” of each value in this data set is 10.96 from the mean.
Don’t worry about having to calculate this equation by hand. Common statistical values such as mean and variance can easily be found using Microsoft Excel or Google Sheets.
How is Variance Used for Investing?
Typically, the greater an investment’s variance, the riskier or more volatile it can be considered to be. For instance, consider the stocks of two companies with 10-year past return data that can be summarized as follows:
● Company A has a variance of 15,000
● Company B has a variance of 7,500
All things being equal, Company B could be considered to be a less risky investment given that it has a lower variance than Company A.
This concept can be further expanded to describe an investor’s entire portfolio using what’s called “modern portfolio theory”. Modern portfolio theory is a method for selecting certain investments in a way that maximizes the investor’s overall return while also keeping the portfolio’s risk at an acceptable level.
Variance is one of the ways that risk is assessed in this calculation. Essentially, the investor will choose various assets from different asset classes with a low or negative correlation (such as stocks and bonds), and their relative variances will be considered.
Standard Deviation vs Variance
Variance and standard deviation are closely related because they utilize the same basic formula. A standard deviation can be defined as the square root of the variance of a data set.
● Variance = σ^2
● Standard deviation = σ
In statistics, it's often more helpful to report the standard deviation of a sample or population than its variance because standard deviation is easier to interpret.
For instance, in our earlier example above, the variance of 10.96 probably didn’t mean much to you because our brains aren’t really sure how to interpret the squared value of something.
If we had instead taken the square root of this variance, we could have said the standard deviation of this data set is 3.31. This now gives us a value that can be used in practical applications.
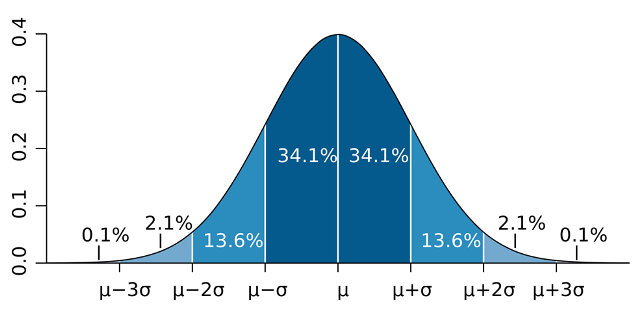
Using a normal bell curve distribution, we can say that:
● 68% of the values were within one standard deviation of the mean: 15.2 +/- (1 x 3.31)
● 95% of the values were within two standard deviations of the mean: 15.2 +/- (2 x 3.31)
● 99% of the values were within three standard deviations of the mean: 15.2 +/- (3 x 3.31)
When used with larger data sets such as population, manufacturing, or natural science where not every data point is known, we can draw more meaningful conclusions about the data set by examining its standard deviation. Of course, this couldn’t be found without calculating its variance first.
The Bottom Line
Calculating the variance of a data set tells us the spread between the measurements and their mean. This technique can be used for populations where every data point is known or samples where only a portion of the data values are known but can reasonably serve as a representation of the entire population.
Variance is widely used in any industry that uses data collection. While it can be used for many purposes, most people are more familiar with its square root (i.e. the standard deviation) and it relates to a bell curve distribution.