
Rather than simply stating the overall size of a company’s profits, EPS breaks this down in a more meaningful way by characterizing how much profit can be attributed to each share of stock. That way each investor knows how much earnings they are making for every share of stock they own.
In general, the higher a company's EPS is, the more profitable it’s considered to be. EPS also provides a method for measuring the company’s profitability over time. Managers and investors can look at the company’s EPS, compare it to previous quarters or years, and determine if they are achieving financial progress.
How is EPS Calculated?
EPS is calculated by taking the company’s profits and subtracting away any preferred dividends. The result is then divided by the total number of shares outstanding.
EPS = [ Net profits - Preferred dividends ] / Shares outstanding
In summary:
- The greater a company’s profits, the greater the EPS
- The more outstanding shares a company has, the lower its EPS
Note that, unlike shares of common stock, shareholders of preferred stock have contractual rights to dividend payouts. Even if the company decides to suspend its dividend, preferred dividends must still be paid. Hence, this is why they must be subtracted from the net income.
Example
To better understand how EPS can give us some insight into a company’s true profitability, here is a simple example comparing two companies.
- Company A has profits minus preferred dividends of $1 million. They also have 100,000 shares of outstanding common stock.
- Company B has profits minus preferred dividends of $5 million. They also have one million shares of outstanding common stock
On the surface, it may seem like Company B is more profitable because it has a greater amount of profits ($5 million vs $1 million). However, let’s calculate the EPS for each.
- EPS for Company A = $1,000,000 / 100,000 = $10 per share
- EPS for Company B = $5,000,000 / 1,000,000 = $5 per share
By calculating the EPS, we can see that it is actually Company A that is more efficient at producing profits than Company B and thus better at creating more value for each shareholder. Hence, this is why framing profitability over the number of shares is more useful than looking at profits alone.
Where Do I Find EPS?
It’s very easy to find the EPS of any publicly traded company. Simply go online to a financial media website, type in the company’s name or stock ticker, and it will display the key financial metrics including EPS.
Here is an example showing the EPS for tech giant Apple (stock ticker AAPL):
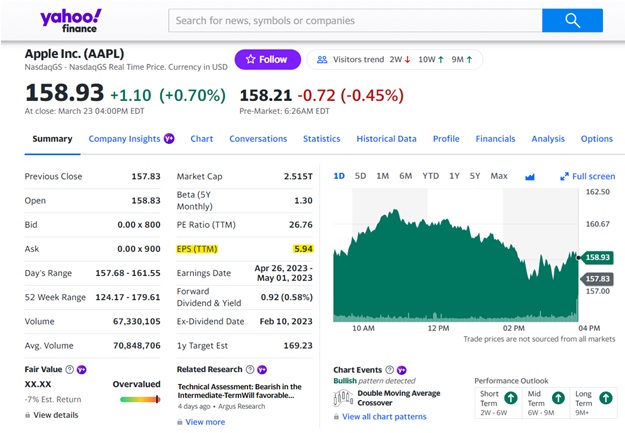
Source: Yahoo Finance
Note that the abbreviation TTM following EPS stands for "trailing twelve months". This means that EPS shown is the total earnings over the last twelve months and not necessarily the company’s fiscal year or calendar year.
Basic EPS vs Diluted EPS
Sometimes when a company reports its EPS, it may state both the basic and diluted values.
- Basic EPS refers to an EPS calculation using the number of actual outstanding shares issued to date. In other words, it's all of the shares that have been traded openly in the stock market. When a company reports one value for EPS to investors, it is typically the basic EPS.
- Basic EPS refers to an EPS calculation using the number of actual outstanding shares issued to date. In other words, it's all of the shares that have been traded openly in the stock market. When a company reports one value for EPS to investors, it is typically the basic EPS.
Knowing the difference between diluted and basic EPS can help an investor better understand potential pitfalls. Although it's unlikely that all of these other variants of shareholder equity would ever be used all at once, there are inherent repercussions if such an action took place.
For instance, let’s say there are ten million shares of stock. As part of their compensation package, the top company executives hold one million shares of unused stock options. If exercised, this would increase the pool of outstanding shares and reduce the EPS by approximately 9%.
Since a diluted share count will always be greater than the basic amount, diluted EPS will always be a lower value than basic EPS.
EPS and Adjusted EPS
Another variation of EPS is something called the adjusted EPS. In this calculation, the analyst will subtract away certain aspects of the earnings that are deemed to be non-recurring. For example:
- The sale of a business division
- The sale of major real estate or equipment
- Emergency relief funds from the government
For instance, let’s say the company sold off one of its products in exchange for a one-time payment of $10 million. While this would technically increase the EPS for the year, it is not something that would happen each year. Therefore, the EPS for this period might look inflated or lead to bias when compared to subsequent periods.
Hence, the company will “adjust” the EPS by removing these one-time activities. This will give a much more accurate indicator of the company's true core performance.
Limitations of EPS
Similar to other financial metrics, investors need to be careful when looking at a company’s EPS. This figure can be manipulated to make a company’s financial health appear better than it really is.
For instance, consider the company’s net profits. Non-cash expenses such as depreciation and amortization are subtracted from net income. Depending on the company’s accounting practices, this can be done in a way that favors the near term and makes the figure more appealing.
Additionally, when it comes to outstanding shares, companies will often buy back their own stock in an effort to reduce this number. Share issuances and splits can also be used to change the denominator.
By itself, EPS does not take into account the market price per share. Therefore, it doesn’t necessarily help an investor understand whether the stock is over or undervalued. For this, you need the PE Ratio.
EPS and P/E Ratio
The price-to-earnings ratio (also written as P/E ratio) is a metric that uses EPS. The P/E ratio takes the price of a stock and divides it by the EPS to get a ratio. This ratio can be thought of as how much the market is willing to pay today for a stock based on its past or future earnings.
As you might guess, manipulation of the EPS will result in a false P/E ratio. This is why it's very important to understand how the EPS was calculated and what aspects are being taken into consideration.
The Bottom Line
Earnings per share is a metric that can be used to reveal how much profit a company can generate for each shareholder. In general the higher the EPS, the more attractive the investment. However, like all financial metrics, EPS can be manipulated and should not be used alone. Therefore, it should be evaluated alongside other key indicators such as P/E ratio, ROE (return on equity (ROE), etc.